Common frequency distribution methods#
Method |
Discription |
|---|---|
fdist = nltk.FreqDist(text) |
freq. dist. object |
fdist.pprint() |
|
fdist[‘exmple’] |
get count |
fdist.freq(‘example’) |
get freq |
fdist.N() |
Total number of samples |
fdist.keys() |
keys in desc order of freq |
for text in fdist |
iterate |
fdist.max() |
key with max freq |
fdist.tabulate() |
tabulate |
fdist.plot() |
plot of freq dist |
fdist.plot(cumulative=True) |
cumulative plot of freq dist |
fdist1 < fdist2 |
compare |
tokenize
FreqDist
findall
pprint
freq
plot
Text Corpora / Corpus
pretty table
[12]:
## frequency distribution
fdist = nltk.FreqDist(text1)

## print([(text,fdist[text]) for text in fdist])
[13]:
fdist.pprint()
FreqDist({',': 18713, 'the': 13721, '.': 6862, 'of': 6536, 'and': 6024, 'a': 4569, 'to': 4542, ';': 4072, 'in': 3916, 'that': 2982, ...})
[14]:
fdist['Sunday']
[14]:
7
[15]:
fdist.freq('Sunday')
[15]:
2.683853553613809e-05
[16]:
fdist.N()
[16]:
260819
[17]:
## fdist.keys()
[18]:
fdist.max()
[18]:
','
[19]:
## fdist.tabulate()
[20]:
fdist = nltk.FreqDist(text)
fdist.plot()
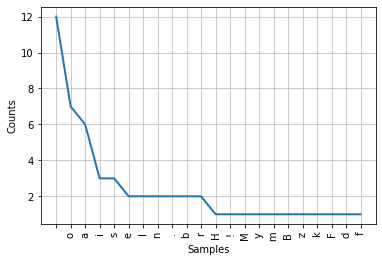
[20]:
<AxesSubplot:xlabel='Samples', ylabel='Counts'>
[21]:
fdist.plot(cumulative=True)
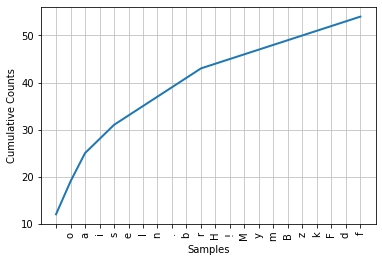
[21]:
<AxesSubplot:xlabel='Samples', ylabel='Cumulative Counts'>
[22]:
## compare
## fdist1 < fdist2
Conditional Frequency#
Conditional Frequency is Frequency Distribution based on conditions.

CFD : Conditional Frequency Distribution
[26]:
cItems = [
    ('F','apple'),
    ('F','apple'),
    ('F','kiwi'),
    ('V','cabbage'),
    ('V','cabbage'),
    ('V','potato')
]
cfd = nltk.ConditionalFreqDist(cItems)
[27]:
cfd.conditions()
[27]:
['F', 'V']
[28]:
cfd['F']
[28]:
FreqDist({'apple': 2, 'kiwi': 1})
[29]:
cfd['V']
[29]:
FreqDist({'cabbage': 2, 'potato': 1})
Method |
Description |
|---|---|
cfdist = ConditionalFreqDist(pairs) |
create |
cfdist.conditions() |
show conditions |
cfdist[condition] |
freq distribution for the condition |
cfdist[condition][sample] |
freq for the given condition |
cfdist.tabulate() |
tabulate |
cfdist.plot() |
plot of freq dist |
cfdist.plot(cumulative=True) |
cumulative plot of freq dist |
cfdist1 < cfdist2 |
compare |